You feel it as a rumble, or maybe a sudden jolt. The ground moves, and in that split second, you wonder: how do scientists actually know when and where an earthquake happens? And how do they measure its power? Today, I’m breaking down how scientists detect and measure earthquakes explained simply—without the jargon, but with real stories, stats, and a few “aha!” moments. Whether you’re a curious eighth grader or just someone prone to late-night earthquake rabbit holes (guilty!), let’s untangle the mystery together.
The Basics: What Even Is an Earthquake?
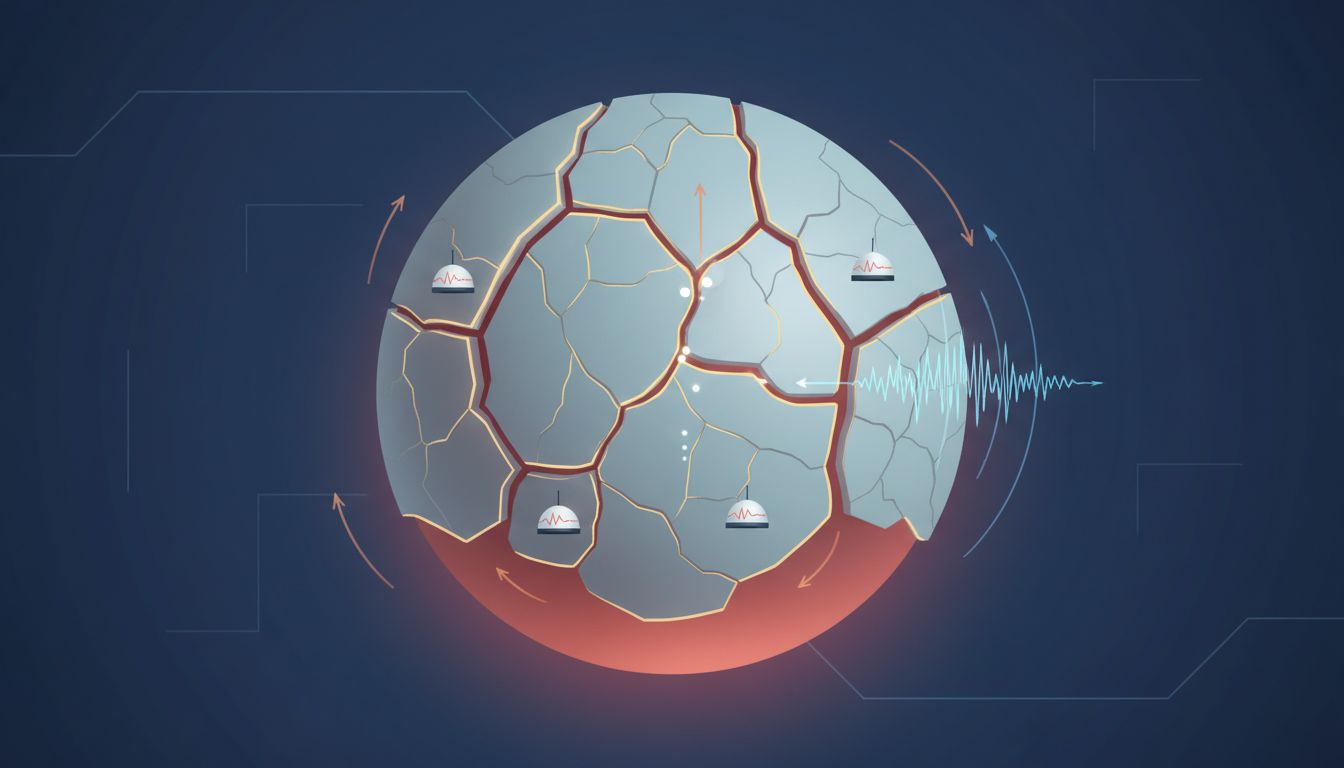
I like to think of Earth’s crust as a giant, cracked eggshell. These cracks are called fault lines, and they’re always shifting just a little—sometimes so slowly we don’t notice. But when the stress gets too high, BAM!—the crust snaps, sending waves of energy rippling out. That’s an earthquake. Easy to picture, right?
Earthquakes happen all over the world, but about 90% shake along the “Ring of Fire,” a horseshoe-shaped zone in the Pacific Ocean. That includes places like Japan, California, and Chile. Some quakes are so weak only sensitive machines notice. Others—well, you don’t forget those.
How Scientists Detect and Measure Earthquakes Explained Simply: The Tools and Tricks
Here’s the heart of it. If earthquakes are invisible, how do scientists spot them? The story starts with an ingenious device: the seismometer.
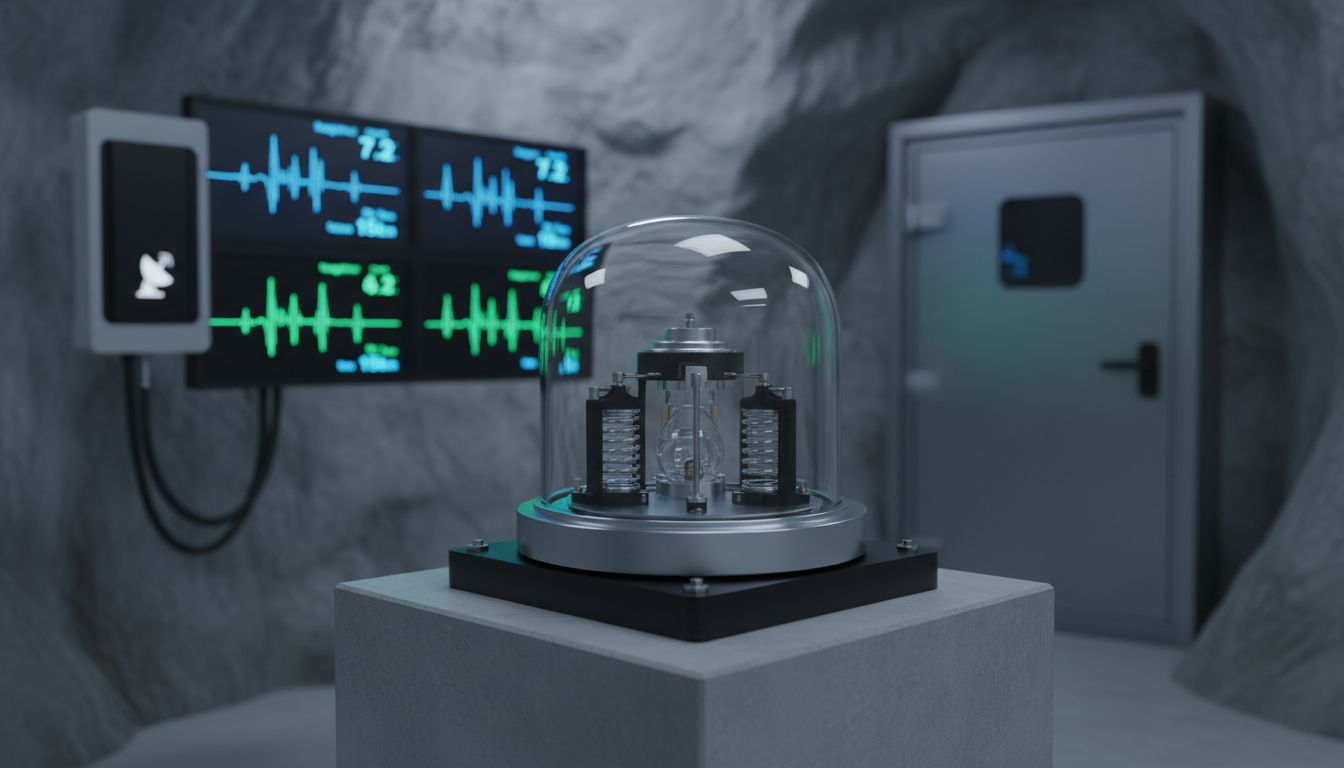
Seismometers: Earthquake “Ears”
Imagine a fancy, extra-sensitive ear pressed against the ground. A seismometer works a bit like that. One part stays really still (usually suspended on a spring), while the rest moves with the ground. The difference between the “still” part and the moving part is recorded as a wiggly line—this is a seismogram.
Hundreds of thousands of small quakes happen every year. According to the U.S. Geological Survey, over 500,000 earthquakes shake the world annually, but only about 100,000 are strong enough for us to feel. That means most are quietly documented by seismometers, without anyone noticing.
The “Network Effect”
One seismometer is good, but a whole network? That’s when things get powerful. Think of trying to locate a sound with one ear versus two. Scientists use networks, often with hundreds or thousands of instruments spread across cities, continents, and oceans to triangulate the location of an earthquake. Using the arrival times of seismic waves at each station, they can pinpoint the epicenter and depth, usually within minutes or even seconds of a quake.
The Science of Measuring: Magnitude, Intensity, and Energy
Here’s something people often miss: there’s more than one way to “measure” an earthquake. Let’s break it down.
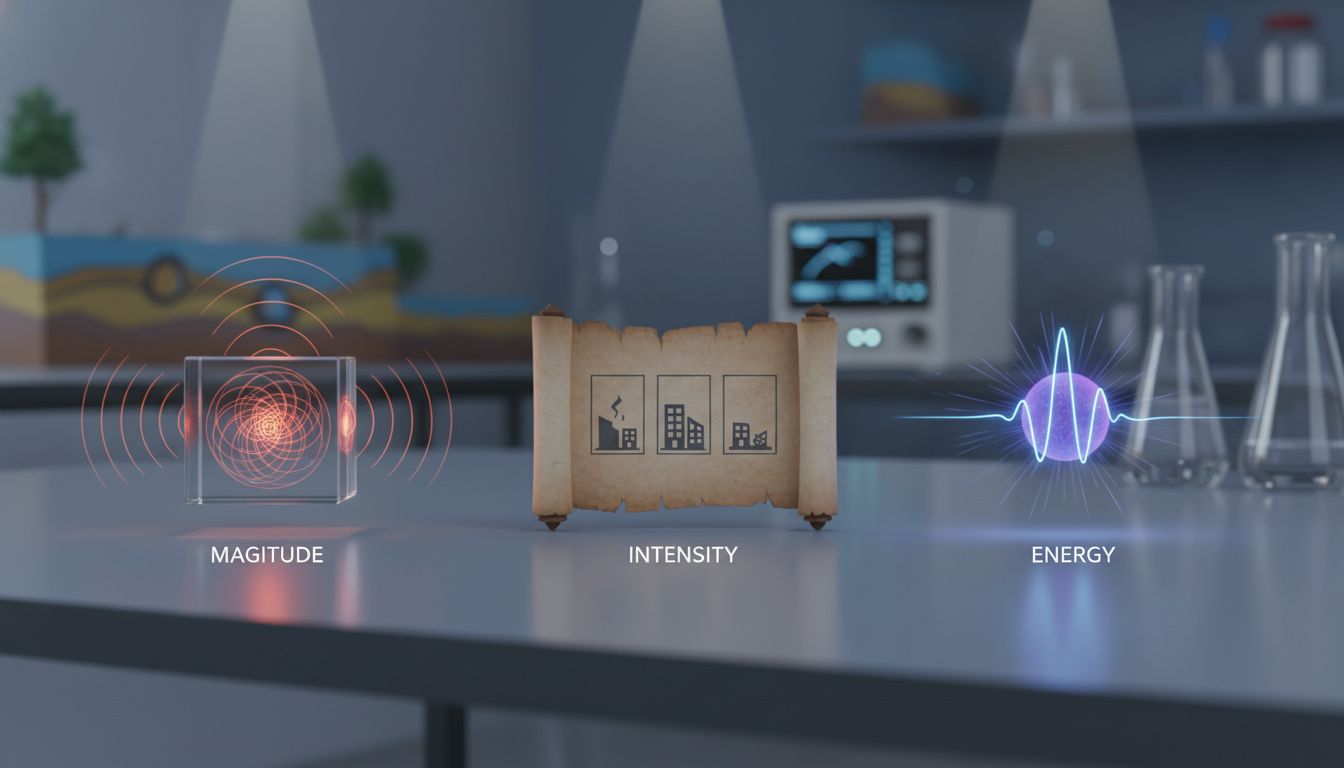
- Magnitude: Refers to the energy released at the source. It’s what the Richter scale and Moment Magnitude scale (Mw) measure. The numbers go up by tenfold with each step; a magnitude 6 quake shakes the ground ten times more than a 5. Mind-blowing, right?
- Intensity: This is how the quake feels to people nearby—the shaking, damage, and chaos. The Modified Mercalli Intensity scale ranks this from I (not felt) to XII (total destruction). A small quake in the middle of a city? High intensity, even if the energy wasn’t huge.
Most significant earthquakes range from Magnitude 5 (noticeable shaking) to Magnitude 9 (catastrophic). The 2011 Japan quake registered a magnitude of 9.0, releasing as much energy as about 600 million times the Hiroshima atomic bomb. That’s not an exaggeration—just physics.
Step by Step: How Scientists Detect and Measure Earthquakes Explained Simply
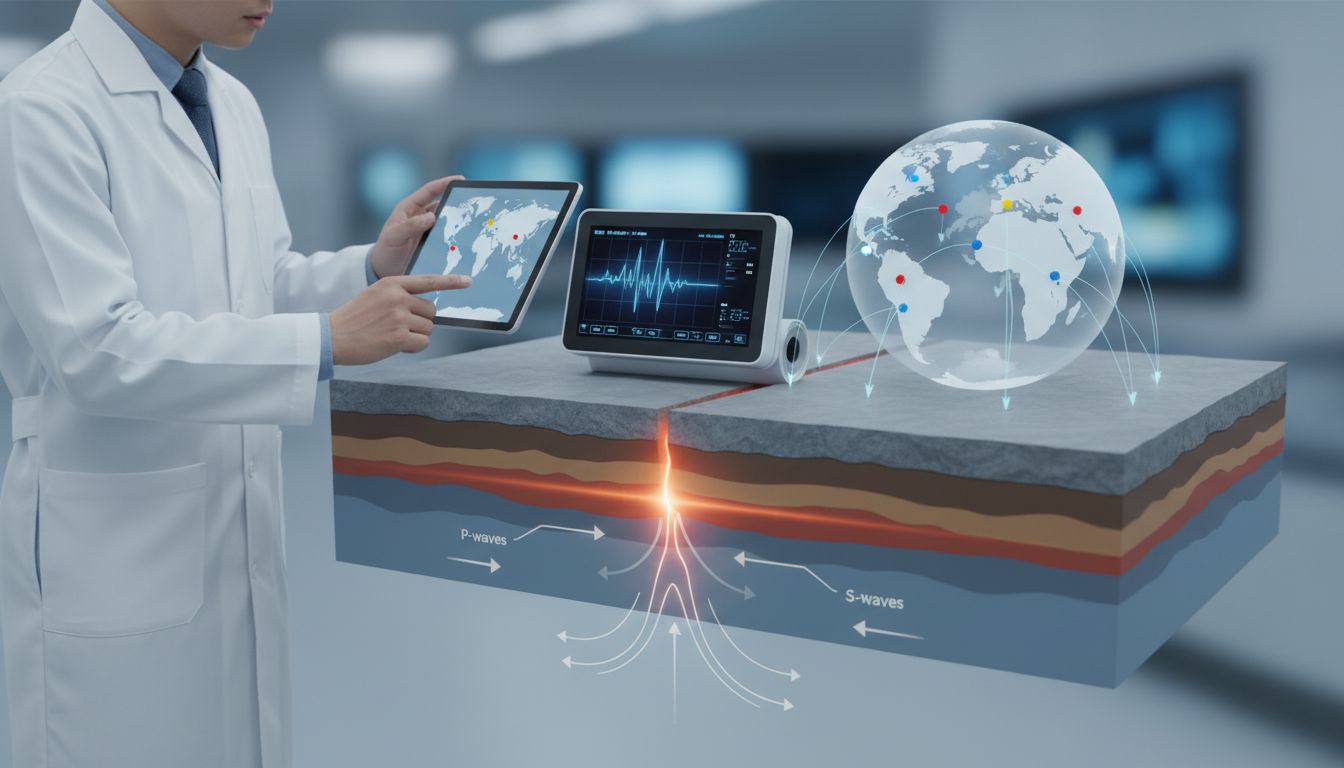
- Shaking Starts. Deep underground, rocks grind and slip. Energy radiates outward as seismic waves.
- Seismometers Record the Waves. Within seconds, stations closest to the quake pick up the first, fastest waves (called P waves), followed by slower, more destructive ones (S and surface waves).
- Networks Share Data. Readings from multiple stations are sent to central computers.
- Computers Triangulate Epicenter. Using the difference in arrival times at different places, software calculates where and how deep the earthquake started.
- Magnitude Is Calculated. The size of the biggest shake (wave amplitude) is plugged into a formula, giving the quake’s magnitude.
- Alerts and Maps Go Out. If it’s big enough, warnings are sent in seconds. Maps show the epicenter and intensity zones.
It’s fast—a global network can spot and measure a quake’s size within 2–5 minutes for most events. For big quakes, speed is survival.
Mini-Case Study: The 1994 Northridge Earthquake
I still remember reading about the Northridge quake in California—6.7 magnitude, just after 4:30 a.m. on January 17, 1994. Seismometers across Los Angeles County shuddered awake, and within three minutes, the USGS had estimated both the epicenter and magnitude. Early data allowed emergency crews to respond faster, even while aftershocks kept rattling the region. In the end, at least 57 people died and thousands were injured, but rapid detection likely saved lives. The lesson was clear: the more seismometers and data, the quicker the response.
Beyond the Machines: Human and Animal Clues
Okay, here’s a fun tangent. Long before fancy electronics, people felt quakes and guessed at their strength based on the damage—cracked walls, toppled vases, dogs barking before the shaking started. Some scientists still interview people after big quakes to map intensity zones (hello, “Did You Feel It?” reports).
There’s even research into animals sensing quakes seconds before humans do, thanks to their keen hearing and vibrations. But so far, no reliable animal-based warning system. The science is still fuzzy, but the stories persist—who knows what we’ll discover next?
Modern Upgrades: Satellites, Smartphones, and AI (But Mainly Humans)
Today, seismic science is evolving even further. Did you know your smartphone can help detect earthquakes? Apps like ShakeAlert tap into a phone’s accelerometer—basically a tiny seismometer in your pocket. In Chile and Japan, smartphone-based alerts reach millions within seconds of a quake’s first rumble.
Satellites now map ground deformation (how Earth’s surface moves up or down during an earthquake) with centimeter-level accuracy. This helps scientists study “silent earthquakes” that slip slowly, often beneath the sea—quakes you’d never feel, but which can unleash tsunamis.
Pros and Cons: Tech vs Human Touch in Earthquake Detection
- High-Tech Pros: Speed, accuracy, real-time data, global reach, and potential early warnings that save lives.
- High-Tech Cons: Expensive (some stations cost $50,000+ each), and vulnerable to power outages or sabotage. Plus, false alarms sometimes shake up the public more than the quake itself.
- Human Pros: Local knowledge, direct observation, and the ability to assess damage and needs right away.
- Human Cons: Slow reporting, mistakes, and sometimes just plain panic.
The sweet spot? A blend of both—the machine for speed, the human for insight. And that’s the direction earthquake science is heading.
Quick Myths About Earthquake Detection
- Myth 1: Earthquakes can be predicted exactly. Nope. Scientists can forecast risk over years or decades, but not pinpoint the day or hour (yet).
- Myth 2: All big quakes have aftershocks. Often true, but not always. Some aftershocks are stronger than the original quake—a real surprise for scientists.
- Myth 3: Animals can reliably warn us. Not yet proven, but fascinating stories keep hope alive!
Patterns and Surprises: What Data Tells Us About Earthquakes
Globally, the number of detected earthquakes has steadily increased—not because the world is shaking more, but because there are more seismometers. In 1970, scientists logged about 4,000 quakes annually (enough for people to feel), but today, thanks to improved detection, it’s over 20,000. Most are harmless, but about 15–20 major earthquakes (magnitude 7 or higher) strike each year, usually in the same risky zones. The more we study, the more we realize Earth has patterns but also loves to surprise us.
FAQ: How Scientists Detect and Measure Earthquakes Explained Simply
How do scientists know where an earthquake started?
They use a network of seismometers. When an earthquake happens, seismic waves reach each station at slightly different times. By comparing these arrival times, computers can triangulate (like GPS for shaking!) the exact spot and depth where the quake began. It’s like hearing a sound and knowing which direction it came from—except with math and maps.
What’s the difference between magnitude and intensity?
Great question! Magnitude measures the energy released at the earthquake’s source—think of it as the raw power. Intensity describes how strong the shaking feels and what kind of damage it causes at a specific place. So, a small magnitude quake near you might feel intense, while a massive one far away could go unnoticed.
Can earthquakes be predicted?
Not yet, unfortunately. Scientists can estimate which areas have a higher risk over years or decades, but predicting the exact moment is still beyond our reach. Research is ongoing, though, and who knows what we’ll discover in the next decade?
What was the largest earthquake ever detected?
The biggest was the 1960 Valdivia earthquake in Chile, with a magnitude of 9.5. It’s the strongest quake ever recorded—and it caused huge tsunamis across the Pacific. Our global network of seismometers picked it up, helping scientists study its immense impact even decades later.
How accurate are earthquake measurements?
Nowadays, they’re impressively accurate. Most epicenters are pinpointed within a few kilometers, and magnitude calculations are generally correct to within 0.1 points. But in remote places (like deep oceans), there’s still some guesswork. The more stations, the sharper the accuracy.
Final Thoughts: The Human Story Behind Earthquake Science
I’ll admit, there’s something humbling about all this. Yes, we have high-tech machines and brilliant data, but at the end of the day, earthquakes remind us that our planet is alive—and sometimes unpredictable. Each detection is a chance to learn, to prepare, to help someone in danger. The next time you see a wavy line on a seismograph, know that it’s more than just a squiggle: it’s a record of Earth’s restless energy, captured by human curiosity and teamwork.
And hey, if you’re ever in a city with a science museum, see if they have a seismometer on display. Give it a stomp and watch the lines jump—you’ll be connecting, for a moment, to a global network built to keep us safer, one shake at a time.